Measure what matters -
Simply and accurately
Track your emissions effortlessly with AI-powered automation. Built to help businesses comply, compete, and decarbonize.
Measure, Report, Decarbonize
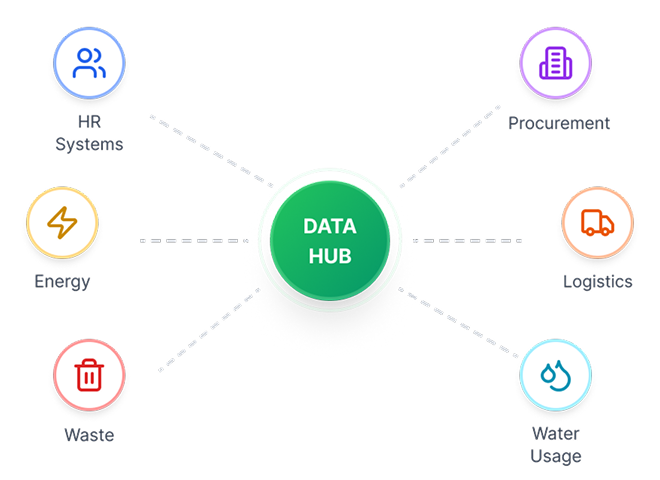
Identify Data Sources
Locate key ESG data across your business – from electricity bills, HR systems, purchase register, logistics, waste generated, water usage etc.
Facility-level
Track individual locations
Business Unit
Department-wise tracking
Company-wide
Enterprise-level view
Set Your Boundaries
Define whether you want to track emissions at the facility level, business unit level, or across the entire company.
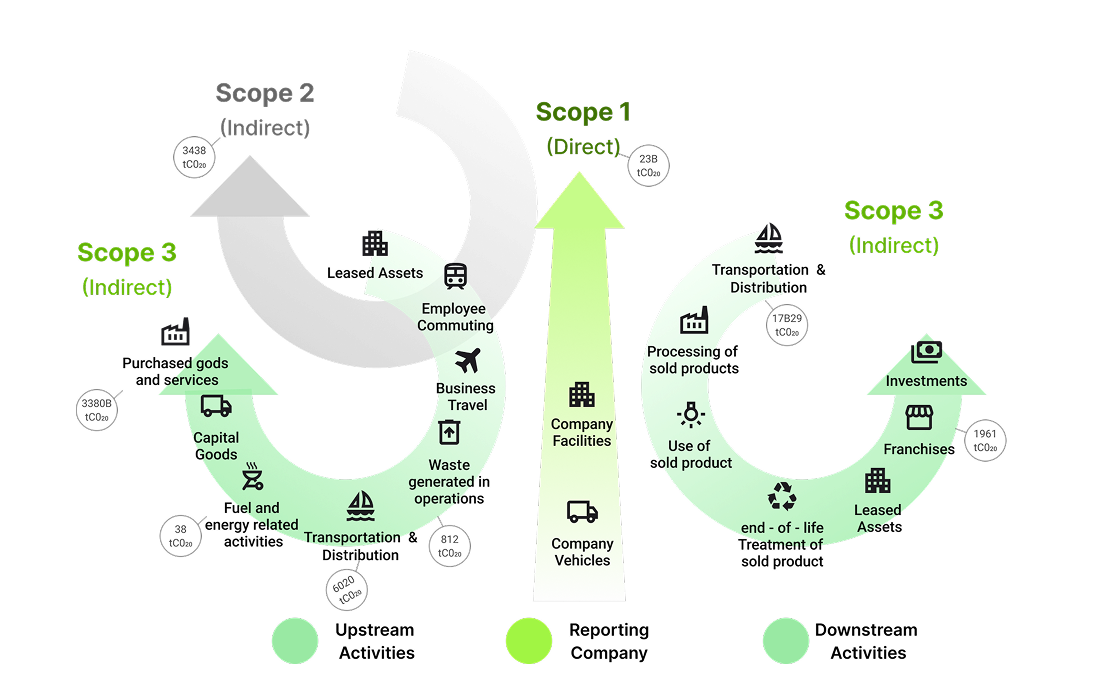
Scope-Based Classification of Greenhouse Gas Emissions
• Direct GHG Emissions - These are emissions from sources that are owned or controlled by the company. Example - Emissions from fuel combustion in owned boilers, furnaces, or vehicles.
• Indirect GHG Emissions from Energy - These are emissions from the generation of purchased electricity, steam, heating, and cooling consumed by the company.
• Other Indirect GHG Emissions - These are all other indirect emissions that occur in the value chain of the reporting company, both upstream and downstream. Example - Emissions from purchased goods and services, Business travel, Employee commuting.
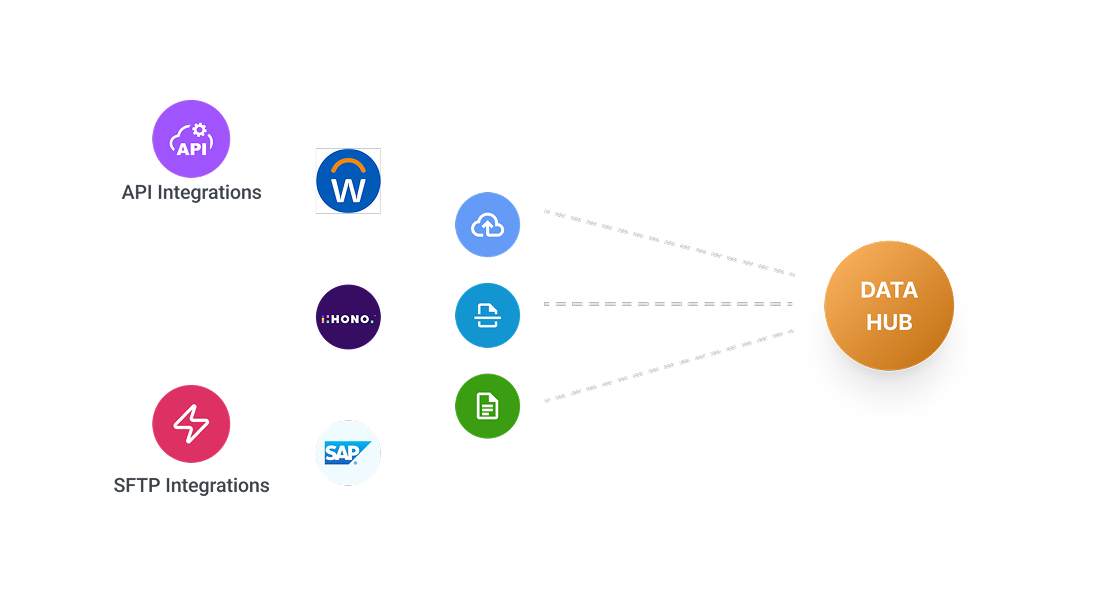
Connect or Upload Data
- API or SFTP integration with systems like SAP, Workday, Hono
- Manual upload via Excel or CSV using guided templates
Enable Maker-Checker Workflow
Assign roles to ensure that data input is reviewed and verified before processing.
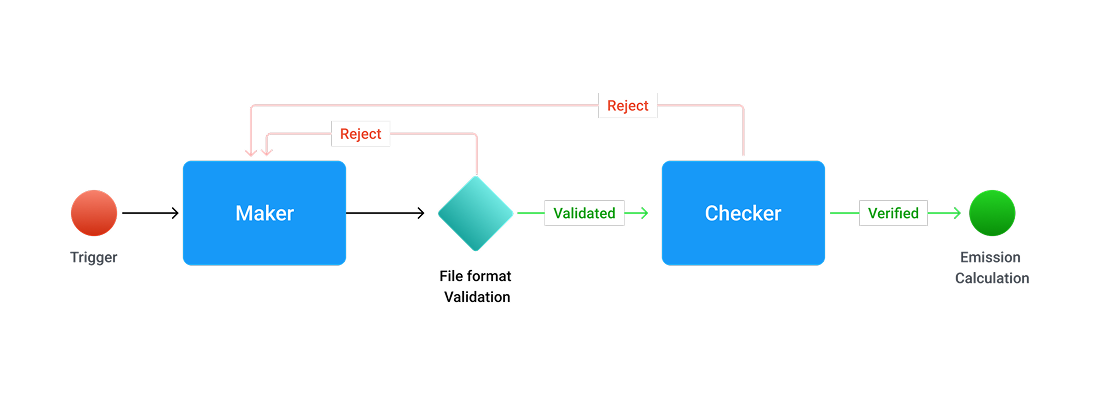
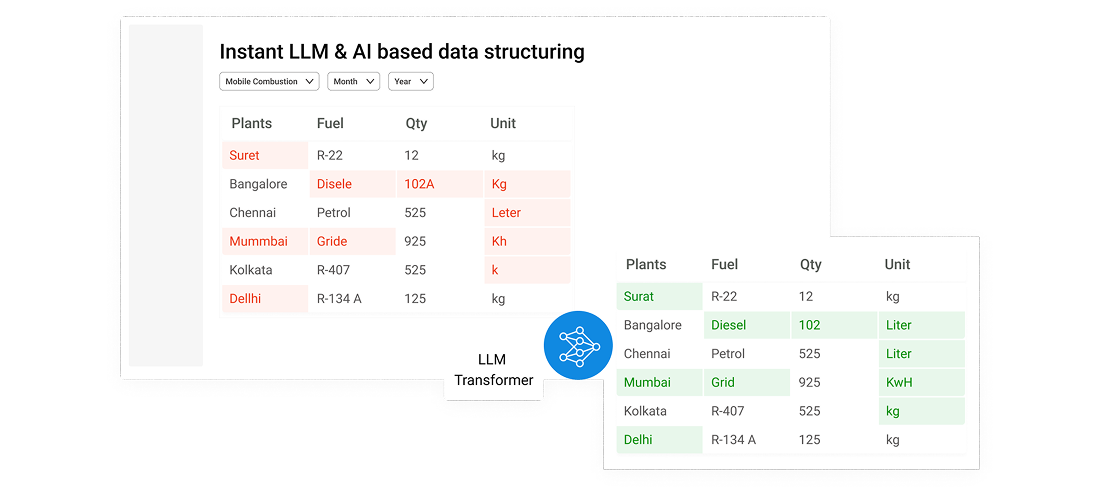
Validate with AI Agent: Clera
Our AI engine Clera checks uploaded data for errors, missing values, and format issues.
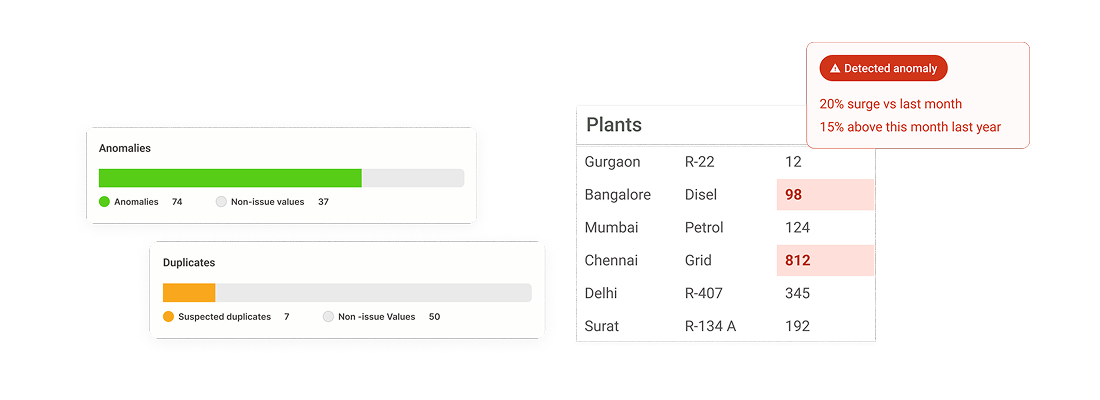
Catch Anomalies with AI Agent: Anova
Our anomaly detection engine Anova flags outliers and possible human errors before emission calculation.
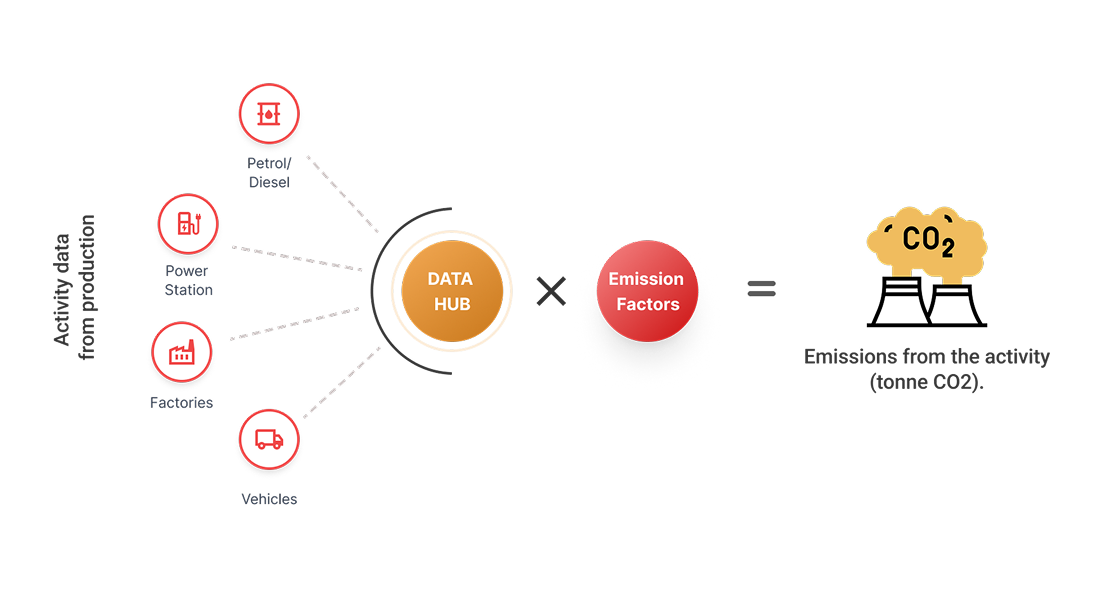
Link to Emission Factors & Calculate
Once Checker-approved, data is matched with verified emission factors Access to best emission factor sources
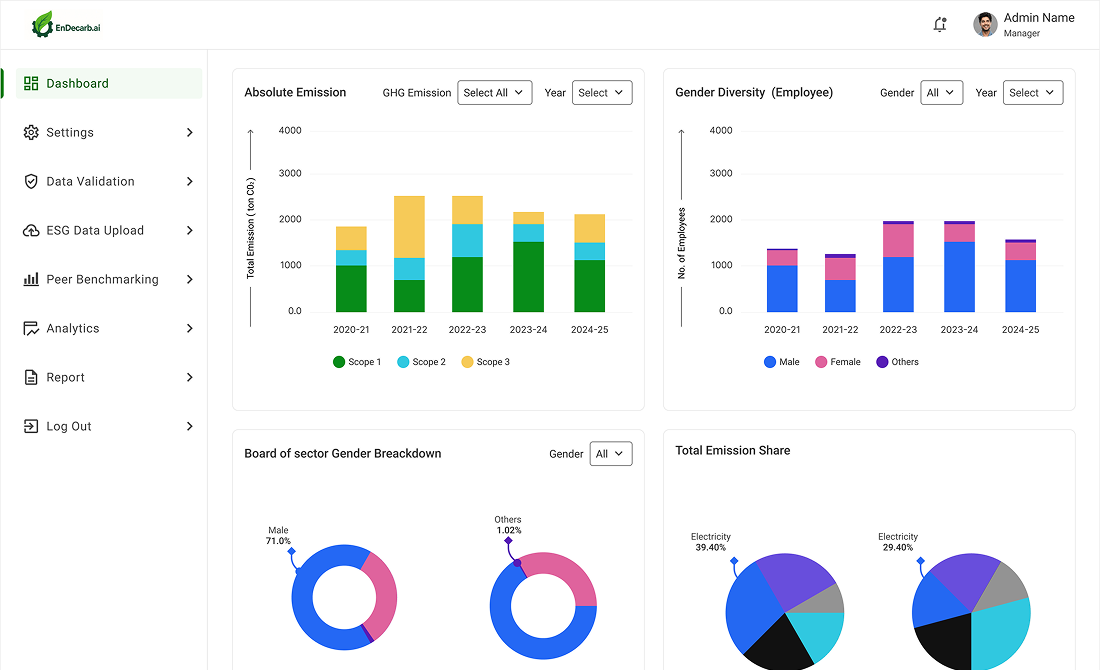
View Insights with AI Powered Dashboard: Ember
Once emissions are calculated, view detailed trends, identify hotspots, and get reduction suggestions via our AI dashboard Ember.
Ready to measure smarter?
From large enterprises to MSMEs, EnDecarb.ai makes
ESG reporting and carbon tracking seamless, smart, and
scalable.