
Know Where You Stand. See Where You Should Be.
Benchmark your ESG performance against industry peers across 100+ metrics — spanning Environmental, Social, and Governance dimensions. AI-driven. Sector-specific. Both quantitative and qualitative.

Flying Blind on ESG? Your Competitors Aren't.
Most companies report ESG metrics in isolation — without context on how they compare to peers, what best practices look like, or where the real gaps are. This leads to misallocated resources, missed opportunities, and blind spots that investors and regulators notice.

No context
"We publish ESG numbers every year, but have no idea if they're good or bad relative to our sector"

Reactive, not strategic
"We only find out we're behind when an investor or rater tells us"

Manual comparisons
"Our team spends weeks pulling competitor data from annual reports"

Surface-level metrics
"We compare carbon intensity but miss governance and social nuances"
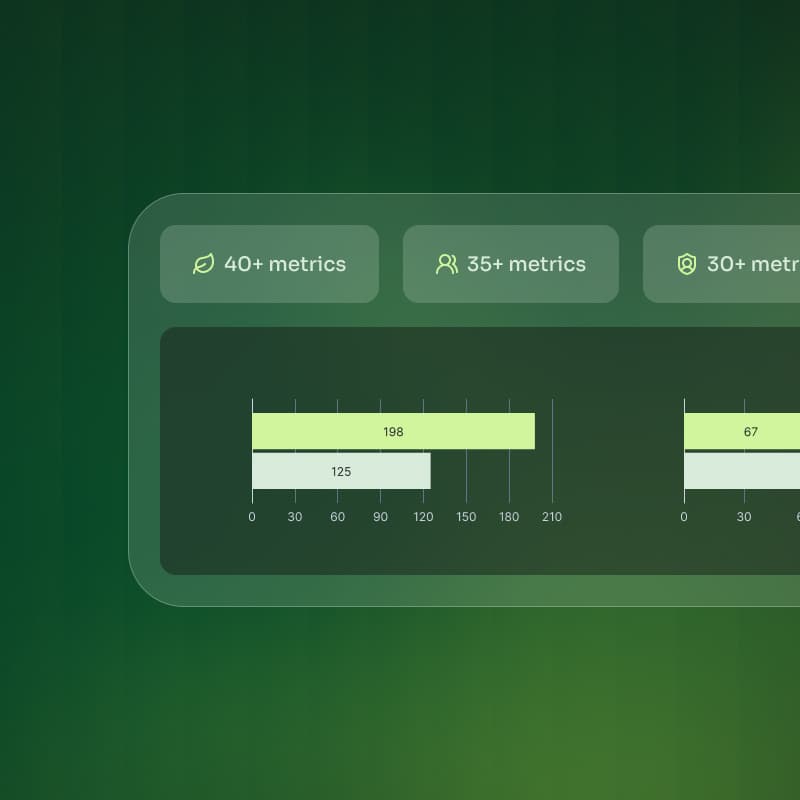
100+ Metrics. Three Dimensions. Complete Clarity.
Our benchmarking framework spans Environmental, Social, and Governance dimensions with both quantitative and qualitative indicators — because a carbon number alone doesn't tell the whole story.
Environmental
Emissions, energy, water, waste, biodiversity, and resource efficiency metrics — both absolute and intensity-based
Quantitative + Qualitative
Social
Workforce practices, health & safety, community impact, diversity & inclusion, and human rights indicators
Quantitative + Qualitative
Governance
Board composition, ethics, risk management, transparency, anti-corruption, and policy frameworks
Primarily Qualitative with quantitative governance scores
Not just numbers — qualitative assessments on policies, commitments, and practices are evaluated alongside hard data
Sector-segregated — a steel company is compared to steel peers, not a software firm
Both leading indicators (targets, policies, commitments) and lagging indicators (actual performance data)
Every Sector Has Its Own ESG Story
Our benchmarking engine adapts to your industry. Metrics, weightings, and peer sets are calibrated to sector-specific materiality — so your comparison is always relevant.


AI That Reads Between the Lines
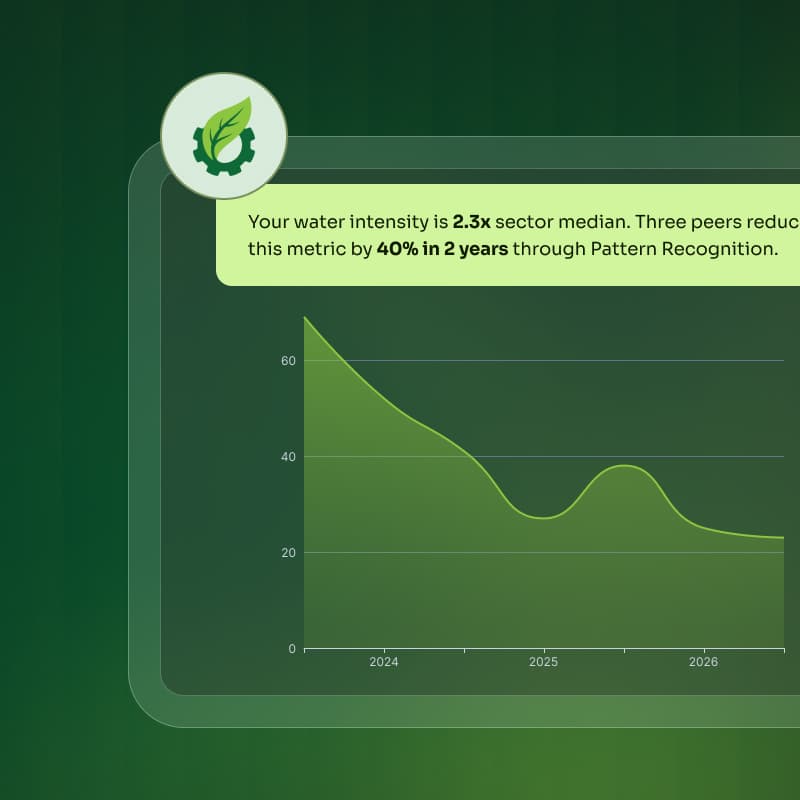
Our AI engine doesn't just compare numbers. It identifies patterns, detects anomalies, surfaces hidden gaps, and generates narrative insights that tell you what's actually happening — and what it means for your strategy.
Pattern Recognition
Spot trends across your ESG performance relative to peers over time
Gap Detection
Automatically identify where you're underperforming against sector leaders
Narrative Insights
AI-generated plain-language summaries that translate data into boardroom-ready talking points
Anomaly Flagging
Surface unusual data points or inconsistencies that deserve attention
Predictive Signals
Early indicators of where your sector's ESG expectations are heading
What You Gain — Five Strategic Outcomes

Gap Identification
See what you're missing
Pinpoint exactly where your ESG performance trails sector leaders — across specific metrics, not just overall scores. Know the gaps before your investors do.

Best Practice Adoption
Learn from the leaders
Understand what top-performing peers are doing differently and adopt proven strategies that move the needle on your ESG scores.

Competitive Advantage
Turn ESG into an edge
Use benchmarking intelligence to position your company as a sector leader — in ratings, in tenders, and in stakeholder conversations.

Investor Confidence
Speak the investor's language
Present ESG performance in the context investors care about — relative to peers, with trend data, and backed by sector-specific analysis.

Regulatory Readiness
Stay ahead of the mandate
Align disclosures with BRSR, CSRD, CDP, and other frameworks. Know where your peers are already compliant — and where you need to catch up.
How It Works — Three Steps
Select Your Peer Set
Choose your sector, define your peer group, and let the platform configure the relevant metrics automatically. Covers listed and unlisted companies with publicly available data.
Get Your Benchmark
AI analyses your ESG data against peers across 100+ metrics. See where you lead, where you lag, and how your trajectory compares — all in one dashboard.
Act on Insights
Receive prioritized recommendations, identify best practices to adopt, and generate investor-ready narratives that position your ESG story in context.
Benchmarking Aligned to the Frameworks That Matter
Our metrics map directly to the disclosure requirements your stakeholders expect.


Stop Guessing. Start Benchmarking.
See exactly how your ESG performance compares to sector peers — across 100+ metrics, powered by AI.
100+ ESG Metrics
10+ Sectors Covered
Quantitative + Qualitative